Daily Leverage Certificates
DLC Hotline: (65) 6226 2828
Market Commentary (Hong Kong)
For the week ending 18 August 2023
Dollar made a new year-to-date high of 7.317 against the Chinese Yuan, PBOC took action to steady its currency by setting yuan fixing at 7.2.
● China’s retail sales in July grew by 2.5% year-on-year, coming in weaker than expected.
● Air China’s July passenger capacity grew by 13.9% month-on-month and 89.6% year-on-year.
● India and the United Arab Emirates completed their first oil trade in Rupees.
● China continued to reduce its US Treasury holdings in June, dropping to a 14-year low of $835.4b.
● Saudi Arabia and China inked infrastructure agreements worth $1.33b at the Saudi-China Business Forum.
● Dollar made a new year-to-date high of 7.317 against the Chinese Yuan; PBOC took action to steady its currency by setting yuan fixing at 7.2.
● Country Garden will be removed from the Hang Seng Index with effect from 4 September 2023 and replaced by Sinopharm Group.
Hang Seng Index closed this week at 17951, down 1124 points or 5.89%. The index gapped down at Monday’s open and closed the week below 18000. The zone above 18000 up to Q1 low of this year was holding the index up since late-May this year. It may be possible that this zone is broken and could turn into resistance. Hang Seng Index was rocked by Country Garden after it missed interest payments on two bonds. Country Garden was ranked China’s largest property developer by sales last year. According to filings, BlackRock, Allianz and HSBC, have exposure to Country Garden Bonds. Besides closing below 18000, HSI also closed below its entire basket of moving averages. This is a setup associated with further losses.
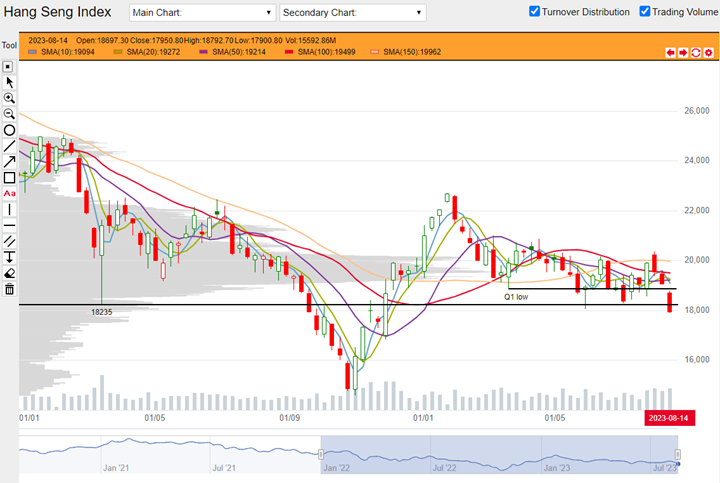
HSI weekly chart from 03 January 2022 to 18 August 2023 (Source: DLC.socgen.com)
Hang Seng Tech closed the week at 4007, down 266 points or 6.22%. In the previous commentary, we observed that HSTech diverged from HSI by making a higher swing high. This was a technical sign that HSTech could be stronger. Despite the same gap-down-and-low-close action as HSI, HSTech’s potential support from 3800-4000 appears to remain intact. This potential support could take some testing if this week’s action continues next week. Short term moving averages were sending positive signals since the past month and although their positiveness appears to be terminated suddenly, HSTech and its component stocks in the sights of bulls should sentiment turn for the better.
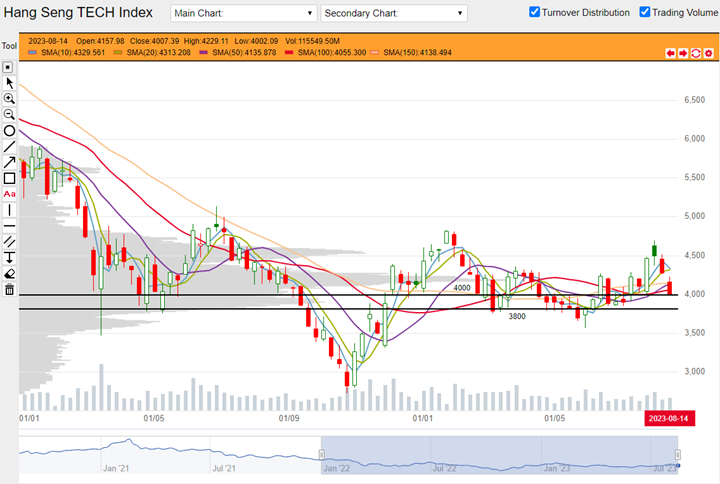
HSTech weekly chart from 03 January 2022 to 18 August 2023 (Source: DLC.socgen.com)
Dow Jones Industrial Average closed at 34501, down 781 points or 2.21%. Nasdaq closed at 14695, down 333 points or 2.22%. Indices are likely weighed down by US 10-Year Treasury Yields which printed a year-to-date high of 4.33%. At this level, yields are just a hair shy of 16 year high printed at 4.335 last year. Both indices closed below their 10, 20 and 50 Day SMAs.
The next FOMC meeting is scheduled on 20 September 2023.
Fed funds futures on rate hike probability by next Fed meeting as at this week’s close:
● 89.0% probability of no change | 11.0% probability of 25 basis points hike
Fed funds futures on rate hike probability by next Fed meeting based on last week’s close:
● 90.0% probability of no change | 10.0% probability of 25 basis points hike
Data indicates a peak rate of 6.00% until July 2024. A rate cut could appear as early as December.
Shanghai Composite closed at 3132, down 57 points or 1.8%. Shenzhen closed at 10459, down 350 points or 3.24%. Shanghai closed below a zone centered around 3170 that was holding the index up since late-May this year. Likewise for Shenzhen with this zone around 10800. Both indices closed below their entire basket of moving averages. This is a setup associated with further losses. The People’s Bank of China responded by cutting a number of policy rates on Tuesday followed by a 168 billion yuan liquidity injection into the banking system on Thursday.
Economic data in coming week:
1. Wednesday 23 August 2023 France, Germany, UK and US reports flash manufacturing and services PMIs.
2. Thursday 24 August 2023 US reports unemployment claims.
Other news:
● CK Asset and Tencent bought back shares.
● CSPC Pharmaceutical, Ganfeng Lithium, Li Ning and Sino Biopharm made new 52-week lows.
● According to Hong Kong Exchange filing, GIC’s long position in Ganfeng Lithium H-shares increased to 7.00% from 6.96% on 9 August 2023.
Technical observations
Sands China 1928.hk closed below all moving averages, perched on opening price of the year.
Note chart features:
1. Sands China closed decisively below its entire basket of moving averages for the first time this year. This is a setup associated with further losses. It could be a signal that Sands China’s uptrend since November 2022 may be over. For now its end-of-week closing price is $26.05 which is just shy of its opening price of $25.90 at the first trading session of this year. $25.90 could be a psychological level. Based on the swing low printed in March this year, $25.90 offered support then.
2. Another notable feature on this chart is $24.70. This is the lowest end-of-week close this year; it marked a swing low in May this year. This chart goes back to the beginning of 2022. When we trace along $24.70 we can find another swing high and another swing low. These observations indicate that $24.70 could be a pivotal level.
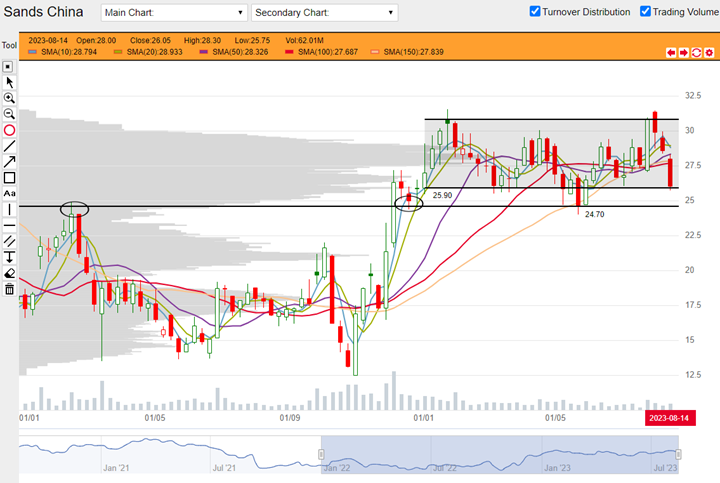
Sands 1928.hk weekly chart from 04 July 2022 to 18 August 2023 (Source: DLC.socgen.com)
Underlying Index/Stock |
Underlying Chg (%)1 |
Long DLC (Bid Change%2) |
Short DLC (Bid Change%2) |
|---|---|---|---|
| Hang Seng Index (HSI) | +0.40% | B00W (+0.86%) | VXRW (-0.35%) |
| Hang Seng TECH Index (HSTECH) | -0.93% | YPCW (-6.25%) | Y9GW (+2.07%) |
| Sands China (1928.HK) | +0.13% | WL5W (+1.69%) |
Brought to you by SG DLC Team
This advertisement has not been reviewed by the Monetary Authority of Singapore. This advertisement is distributed by Société Générale, Singapore Branch. This advertisement does not form part of any offer or invitation to buy or sell any daily leverage certificates (the “DLCs”), and nothing herein should be considered as financial advice or recommendation. The price may rise and fall in value rapidly and holders may lose all of their investment. Any past performance is not indicative of future performance. Investments in DLCs carry significant risks, please see dlc.socgen.com for further information and relevant risks. The DLCs are for specified investment products (SIP) qualified investors only.
Full Disclaimer - here